SORTEO is an acronym for "Simulation Of Realistic Tridimensional Emitting Objects".
SORTEO also means Random Drawing in Spanish, which is pretty appropriate for a Monte Carlo-based simulator.
This simulation platform was born from the fruitful collaboration between the CERMEP imaging centre in Lyon (France) and the McConnell Brain Imaging Centre in Montreal (Canada).
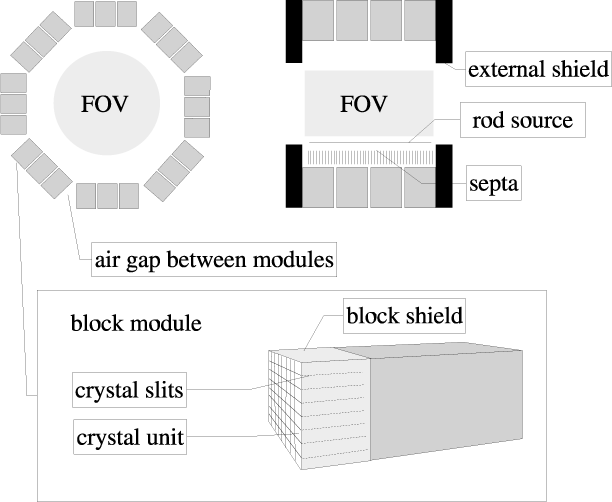
This simulation tool uses Monte Carlo techniques to generate realistic PET data from voxelized descriptions of tracer distributions, in accordance with the scanner geometry and physical characteristics.
PET-SORTEO, accounts for all the major sources of noise and biases that can occur within the formation of PET images and permits faithful reproduction of the image formation process of modern tomograph.
Visit the "Model" section to have a better understanding of the PET-SORTEO simulator.
We felt that many users would only want simulated volumes for designing, testing, optimizing and validating dedicated correction and processing methods.
Therefore, we have built a database of simulated volumes which is freely available (after a registration step, though ! Read the Terms of Use ...). This database has the merit to provide the community with realistic PET studies for commonly used radio tracers, for which the underlying anatomical model and the true activity levels within each structure are well known.
This database is in constant evolution with the addition of anatomical and functional models.
The simulation model accounts for :
Computation efficiency
On average, 1 CPU hour (Opteron 246) is required per chunk of billion of disintegrations for standard brain studies (see the computation time in the database).
Whereas, PET-SORTEO is pretty fast compared to other simulators, it allows for parallel processing.
More informations about hte simulation model and its validation may be found in :
I. Introduction
Using PET-SORTEO, we generated a database of simulated PET Brain studies accounting for inter-subject anatomical variability.
For that purpose 17 different numerical brain models were defined associated with 3 functional models for FDG, Raclopride and Fdopa studies.
The underlying anatomical variability relies on the use of these 17 numerical head models associated with their MR data.
Such database is highly desirable for the evaluation of various kinds of image processing methods in a fully controlled environment.
Indeed, this database provides the community with a set of realistic PET volumes whose functional parameters and underlying anatomy are perfectly determined.
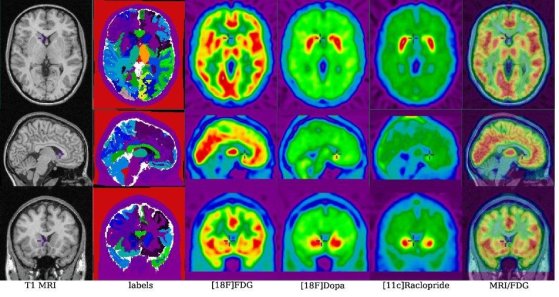
The data related to a single head model :
i) the anatomical data, ii) the anatomical model (labelled volume),
iii) the simulated [18F]FDG data, iv) the time average simulated [18F]Dopa
data and v) the time average simulated [11C]Raclopride data.
The last column shows the superposition of the simulated functional
FDG data on the anatomical data
II. Materials & Methods
II.1 Numerical phantom
Two numerical head models, manually segmented by neuro-anatomists from high resolution anatomical T1-weighted MRI scans, were used : the Zubal [1] and the Jacob [2] head phantoms.
Each manually segmented head model is roughly composed of 60 cerebral and extra cerebral regions.
Fifteen additional head numerical models were generated from T1-weighted MRI of adult subjects without pathology using automated processing tools designed at the McConnell Brain Imaging Centre (www.bic.mni.mcgill.ca).
Therefore, the underlying anatomical variability of the proposed database relies on the use of 17 different numerical head models associated with their MR data.[1] I. G. Zubal, C. R. Harrell, E. O. Smith, Z. Rattner, G. Gindy, and P. B. Hoffer, "Computerized three-dimensional segmented human anatomy," Med. Phys., vol. 21, no. 2, pp. 299-302, 1994.
[2] N. J. Kabani, D. J. MacDonald, C. J. Holmes, and A. C. Evans, "3D anatomical atlas of the human brain," in NeuroImage, A. W. Toga, R. S. Frackowiack, and J. C. Mazziotta, Eds., vol. 7, no. 4., Human Brain Mapping, May 1998, p. 717.
II.2 Functional Models
So far, three different functional models for brain studies were used : [18F]FDG, [18F]Dopa and [11C]Raclopride.
For each radiotracer, 17 PET studies were simulated from the set of numerical head models.
Each functional model consists in the definition of Time Activity Curves to be assigned to the brain model structures. In each case, the TACs were derived from actual human PET data which were fully corrected (scatter, randoms, attenuation, systeme dead-time, radioisotope decay).
Furthermore, the measured TACs were compensated for Partial Volume Effects (PVEs) using the method described in [3].[3] V. Frouin, C. Comtat, A. Reilhac, and M.-C. Grégoire, "Correction of partial-volume effect for PET striatal imaging: Fast implementation and study of robustness," J. Nucl. Med., vol. 43, no. 12, pp. 1715-1726, Dec. 2002.
II.3 Simulation of the raw data and reconstruction
-a- Transmission data :
The transmission scan of each of the 17 head phantoms was individually simulated with PET-SORTEO for the Ecat Exact HR+ scanner following a standard protocol of 10 minutes acquisition. More than 360 billions disintegration histories were tracked during each transmission scan simulation.
For each brain model, the 2D attenuation factors were derived from the transmission data and a high statistic blank scan. Then an attenuation map was reconstructed from the 2D correction factors and forward projected to generate the oblique correction factors, forming the full set of correction factors for 3D emission scans.-b- Emission for [18F]FDG PET studies :
The 3D emission protocol consisted in the collection of data over a 10 minutes period onto a single time-frame, during which an average of 16.41 billions disintegration histories were simulated.
On average, 17 CPU hours were needed to complete each [18F]FDG study on a AMD Opteron processor (model 246 - 2 GHz).-c- Emission for [18F]Dopa PET studies :
The 3D dynamic emission protocol consisted in the collection of the coincidence events over a 90 minutes period onto 27 time-frames : 6 of 30 seconds, 7 of 60 seconds, 5 of 120 seconds, 4 of 300 seconds and finally 5 of 600 seconds.
An average, 20.5 hours of CPU time (Opteron 246) were required per study, during which 18.86 billions simulated disintegrations were tracked.-d- Emission for [11C]Raclopride PET studies :
The 3D dynamic emission protocol consisted in the collection of prompt events over a 60 minutes period onto 26 time-frames: 6 of 30 seconds, 7 of 60 seconds, 5 of 120 seconds and finally 8 of 300 seconds. For each scan, it took on average 24 hours of CPU time (Opteron 246) to track the 23.5 billions simulated disintegrations.
-e- Correction of the raw projections and reconstruction
Emission data were normalized, calibrated and corrected for randoms, scatter contamination, attenuation, dead-time, arc, radioelement decay. Finally, data were reconstructed using the standard 3D filtered back projection algorithm with the Hanning filter and a cutoff frequency of 0.3 mm-1.
Please, use the interface below to select the data to be downloaded. Note that sinogram data are available in Ecat7 format (please visit http://amide.sourceforge.net/packages.html).
Reconstructed images as well as label and mri data are available in minc format.
The Minc file format is a highly flexible medical image file format built on top of the NetCDF generalized data format. The format is simple, self-describing, extensible, portable and N-dimensional, with programming interfaces for both low-level data access and high-level volume manipulation. On top of the libraries is a suite of generic image-file manipulation tools. The format, libraries and tools are designed for use in a medical-imaging research environment: they are simple and powerful and make no attempt to provide a pretty interface to users. Please visit http://www.bic.mni.mcgill.ca/software/ for more details. Minc would provide you many tools that I could not survive without. The installation packages can be found at http://packages.bic.mni.mcgill.ca/.
Alternatively, if you want to stick with your programs and format, the minc distribution will provide you with converters to write your data in Ecat7 or raw format. Using (X)Medcon or Amide, you will be able to convert the Ecat7 or raw files in many other formats.
Well, if you still don't know how to handle these files, contact me.
PET-SORTEO simulation model
Validation studies using PET-SORTEO
This work has been carried out within the frame work of Anthonin Reilhac 's Ph.D. thesis.
However, the sucess of this project relies on the following contributors :
For any questions, I fear that you need to get in touch with me.
Alternatively, you can send an email to Nicolas Costes or Alan. C. Evans.